Developing web pages for mobile devices or debugging your hybrid app is often difficult. But luckily for folks designing on iOS, starting way back with iOS 6, Apple offers a remote web inspector feature in iOS.
Web Inspector allows web and mobile app developers use macOS and OS X Safari Developer Tools to remotely debug web content or hybrid apps in mobile Safari on iPad or iPhone.
It’s an easy and practical way to debug, optimize and modify your web pages or hybrid apps on iOS. 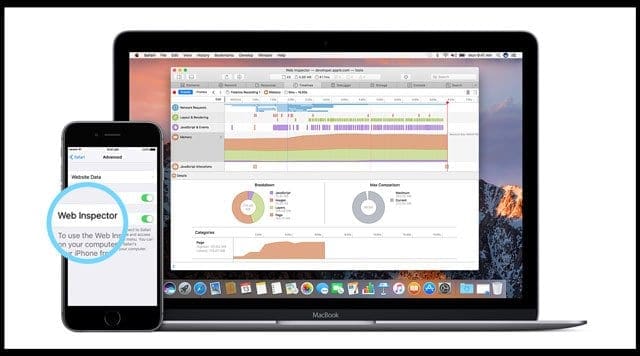
To access these development tools, enable the Develop menu on your Mac’s Safari’s Advanced preferences.
Contents
Related Articles
- View Webpage HTML Source Code on iPad or iPhone. No App Required!
- How To View HTML Source Code in Safari
- How To See Favicons in Safari for iPhones and Macs
Mac Computer Required
Sorry Windows folks but Safari’s Web Inspector is only compatible with Macs!
Use the Same Apple ID and iCloud Sync!
Make sure both your iDevice and your Mac are signed in with the same Apple ID and that you toggle ON Safari in iCloud.
For your iDevice: Settings > Apple ID Profile > iCloud > Safari > toggled ON
For your Mac: Apple Menu > System Preferences > iCloud > Safari > Checkmarked
And Check that Safari is the Same Version Too
Make sure Safari on your Mac is the same version as Safari on your iDevice. You may need to update your iOS version or your version of Safari running on your Mac.
Use Web Inspector to debug mobile Safari
1. On your iPad, iPhone or iPod touch, tap Settings > Safari > Advanced and toggle on Web Inspector. And enable JavaScript if it isn’t already enabled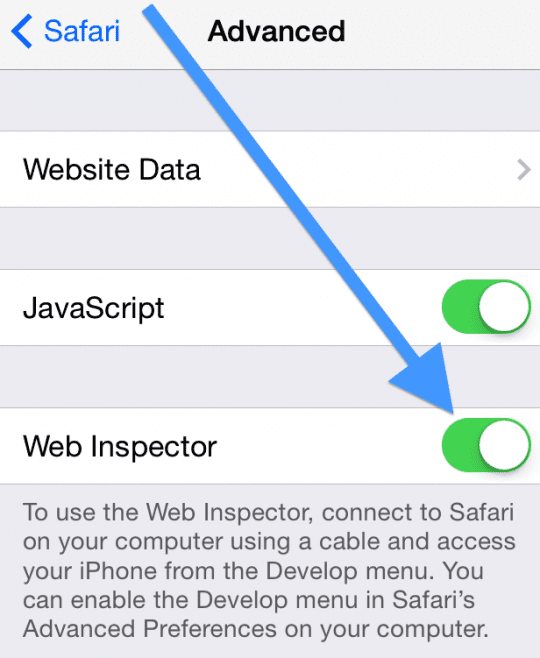
2. On your Mac, launch Safari and go to Safari menu > Preferences > Advanced then check “Show Develop menu in menu bar” if you have not done so already
3. Connect your iOS device to your Mac with the USB cable. This is critical–you must connect the devices manually, using a cable. It does not work via WiFi!
4. Now on your iPad, open the website that you want to debug, then, on your Mac, open Safari and go to the “Develop” menu. You now see your iDevice that you connected with your Mac. If you do not have any page open on your iDevice, you see a message saying “No Inspectable Applications.”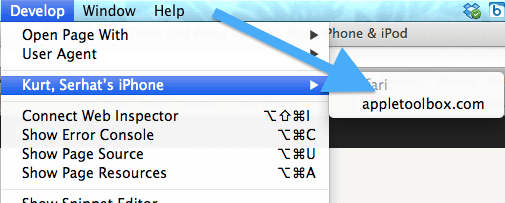
5. Now debug the page that is open on mobile Safari just like you would debug on Mac, inspect DOM elements, modify CSS, measure page performance and run Javascript commands.
Use the debugger tool to help you find the cause of any JavaScript errors on your webpage. You can add breakpoints, debug the javascript and inspect the value of the variables at runtime.
Safari should also detect any CSS, HTML, and JavaScript errors. And you’ll see the details of each error in the debugger.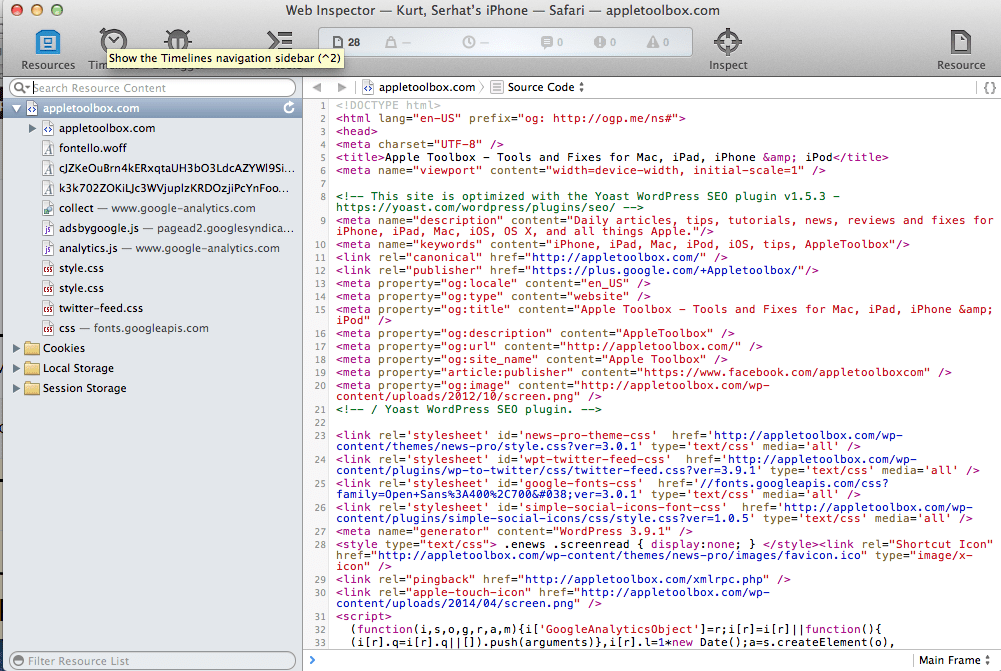
iDevice Not Showing Up in the Develop Menu in Safari?
- Clear your Safari cache and cookies
- Update Safari on your Mac and iDevice if an update is available
- If you run a beta iOS or macOS version, you may need to run the latest beta on all devices
- Try Another cable and/or port on your Mac. Make sure that cable is a genuine Apple lightning cable or MFI Certified (Made For iPhone)
- Check that Web Inspector is toggled ON. iOS updates sometimes toggle this back to the default OFF setting. So just make sure to check Settings > Safari > Advanced > Web Inspector
- Try toggling Web Inspector Off, wait 10 seconds, and toggle back on
- Try Safari Technology Preview browser instead
- Quit of Safari on your Mac and restart it. See if your Mac’s Safari then recognizes your device and allows debugging
- Check that you are not using Safari’s Private Browsing mode if your iDevice only briefly shows up in Safari’s Develop menu and then disappears
- Open Activity Monitor and check what’s going on with Safari
Reader Tips 
- If you’re using an older iDevice with iOS 6 or earlier, your device’s Safari web browser has its own built-in Debug Console! Just access Safari’s Debug Console by going to Settings > Safari > Developer > Debug Console